2019
Mapping Social Cohesion
The Scanlon Foundation Surveys

90 questions
65 substantive and 25 demographic.

Two modes of survey used
Interviewer administered telephone survey and self-administered via the probability-based Life in AustraliaTM (LinA) panel.

3,533 respondents
1,500 respondents interviewer administered, 2,033 respondents self-administered.

13 additional questions in the 2019 survey
Including three new questions regarding Australia’s foreign relations.

19.9 million in 2006; ticking over to 25.5 million in 2019
Australia’s population has grown by almost 5.6 million since 2006.

28% of Australians are born overseas
This ranks Australia first within the OECD amongst nations with populations over 10 million.

Population growth has been uneven across Australia
For the year to March 2019, fastest growth was recorded in Victoria, where the population grew by 2.1% (followed by QLD at 1.8% and NSW at 1.4%).

2 million Australians are members of faith-groups other than Christian
This represents an increase of 84% since 2006.
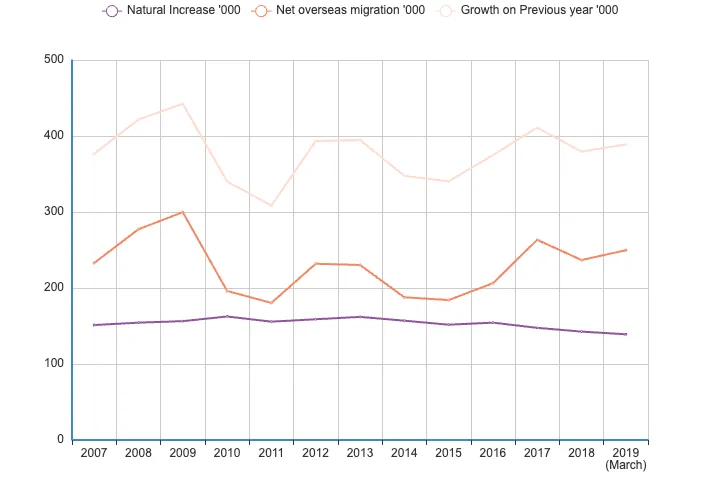
Factors influencing population growth
Components of annual population growth
There are two components of population growth: natural increase and net overseas migration (NOM), which represents the net gain of immigrants arriving less emigrants departing. Between 1975 and 2005, natural increase accounted for 58% of population growth. Since 2006, net overseas migration has been the major component. NOM accounted for 64% of growth in the year to March 2019.
According to the ABS:
- One person is born every 1 minute 46 seconds
- One death occurs every 3 minutes and 19 seconds
- One person arrives every 59 seconds
- One Australian resident leaves every 1 minute and 24 seconds
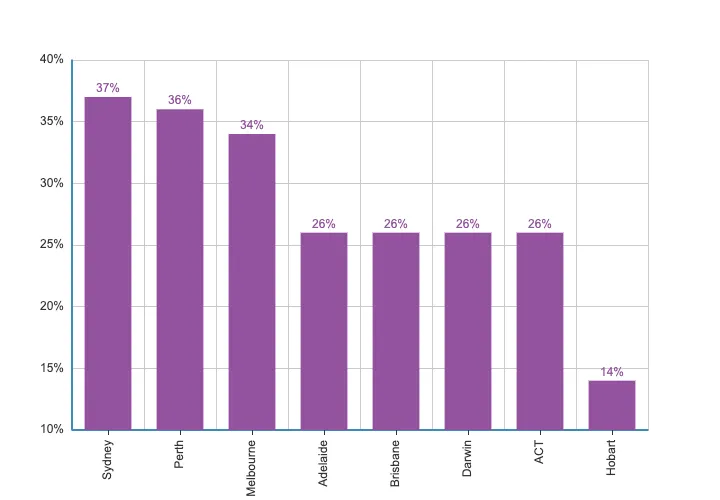
A high proportion of the overseas-born in Australia live in capital cities
of the overseas-born population live in capital cities.
of the Australian-born population live in capital cities.
of the total population live in capital cities.
Where the overseas-born population lives
Population by capital city (2016)
Sydney, Melbourne and Brisbane together account for 51% of Australia’s population, 67% of population growth, and 72% of net overseas migration.
Australia’s immigration program
Permanent immigration and long-term visas
Within Australia’s permanent immigration program, the main categories (in order) are Skill, Family and Humanitarian.

In 2018-19 the permanent intake under the Skill and Family streams at 163,000 was the lowest in more than a decade.
In recent years the numbers entering on long-term visas, primarily comprising overseas students, business visa holders, and working holiday makers, have exceeded permanent entrants, a marked change from the previous emphasis on permanent immigration.
Australia’s immigration program
Temporary entrants resident in Australia

New migrants
Permanent additions to Australia’s population by top ten countries of birth
Australia’s immigrants are increasingly drawn from the Asian region. In 2017-18, of the top ten source countries, seven were in the Asian region, the exceptions being the United Kingdom, South Africa and the United States of America.

Of the estimated population in 2018, the leading overseas-born countries of birth were the United Kingdom (992,000), China (651,000), India (592,000), and New Zealand (568,000)
Religious, cultural and language diversity
Religious affiliation in Australia, 2006, 2016 at the Census
Alongside Australia’s growth in ethnic diversity, members of faith groups other than Christian increased by 84% between 2006 and 2016 – from 1.1 million to 2 million.

In 2019, the Scanlon Foundation survey asked
What do you think of the number of immigrants accepted into Australia?

While opinion on the current intake has fluctuated, general questions on immigration policy continue to obtain a large measure of positive response.
Consistent with previous years, there is majority agreement that accepting migrants from different countries makes Australia stronger, and that multiculturalism has been good for Australia.
of respondents are of the view that the immigration intake was ‘about right’ or ‘too low’.
of respondents agree that multiculturalism has been good for Australia.
agree that accepting migrants from different countries makes Australia stronger.
In 2019, the Scanlon Foundation survey asked
Accepting immigrants from many different countries makes Australia stronger
While opinion on the current intake has fluctuated, general questions on immigration policy continue to obtain a large measure of positive response.
Consistent with previous years, there is majority agreement that accepting migrants from different countries makes Australia stronger, and that multiculturalism has been good for Australia.

In 2019, the Scanlon Foundation survey asked
Multiculturalism has been good for Australia
Within Australia’s permanent immigration program, the main categories (in order) are Skill, Family and Humanitarian.

In 2019, the Scanlon Foundation survey asked
Concerns about immigration

Attitudes towards immigration, two age groups and highest educational attainment compared

In 2019, the Scanlon Foundation survey asked
Do you agree or disagree that when a family or individual applies to migrate to Australia, that it should be possible for them to be rejected purely on the basis of their race or ethnicity?

In 2019, the Scanlon Foundation survey asked
Do you agree or disagree that when a family or individual applies to migrate to Australia, that it should be possible for them to be rejected purely on the basis of their religion?

In 2019, the Scanlon Foundation survey asked
Do you agree or disagree that when a family or individual applies to migrate to Australia, that it should be possible for them to be rejected simply on the basis of their religion? (by political party)

In 2019, the Scanlon Foundation survey asked
What is the most important problem facing Australia today?

Concern across population segments
Concern about the environment was most pronounced in young adults, with 43% of respondents aged 18-24 nominating it as the most important problem facing Australia.
Higher levels of concern for the environment were shared by those who described their financial situation as ‘prosperous’ or ‘very comfortable’ (27%), Greens voters (54%) and those with a Bachelor’s degree or higher (24%).


Environmental concern over time
Back in 2011, the environment ranked highly as the most important problem facing Australia at 17%, though 6% of the total 17% were indicating scepticism, or concern about government overreaction to climate change. The level of scepticism has fallen significantly since, indicated by 1% or less of respondents between 2013-2019.

Lowering concern over quality of government

In 2019, the Scanlon Foundation survey asked
How often do you think the government in Canberra can be trusted to do the right thing for the Australian people?

Trust across population segments
Results from previous years have shown a key predictor of trust in government is a person’s support or opposition to the party in power. Accordingly, the 2019 survey showed trust at a level of 49% among Liberal/National party supporters.
Similarly, trust was close to 50% among those who described their financial situation as ‘prosperous’ or ‘very comfortable.’
Trust was lowest among those who described their financial situation as ‘struggling to pay bills’ or ‘poor.’
In 2019, the Scanlon Foundation survey asked
Would you say the system of government we have in Australia works fine as it is, needs minor change, needs major change, or should be replaced?

Analysis of sub-groups
Analysis of sub-groups indicate a high proportion of those in favour of systemic change among those who intend to vote for ‘One Nation’ (73%); those whose self-described financial status is ‘struggling to pay bills’/’poor’ (65%); and those whose highest completed education is ‘Up to Year 11’ (50%).


nominate concern over quality of government as the ‘most important problem facing Australia.’
believe that Australian democracy ‘works fine’ or ‘needs minor change.’
In 2019, the Scanlon Foundation survey asked
To what extent do you have a sense of belonging in Australia?

In three or four years, do you think that your life in Australia will be…?

In 2019, the Scanlon Foundation survey asked
Are growing economic ties between Australia and other countries, sometimes called globalisation, good or bad for Australia?

Which country do you think is Australia’s most important economic partner?

Which country do you think will have the most influence in the Pacific region in ten years from now?

How much confidence do you have in the Chinese/ United States/ Japanese government to do the right thing regarding Australia’s economic interest?’

Negative attitudes and discrimination

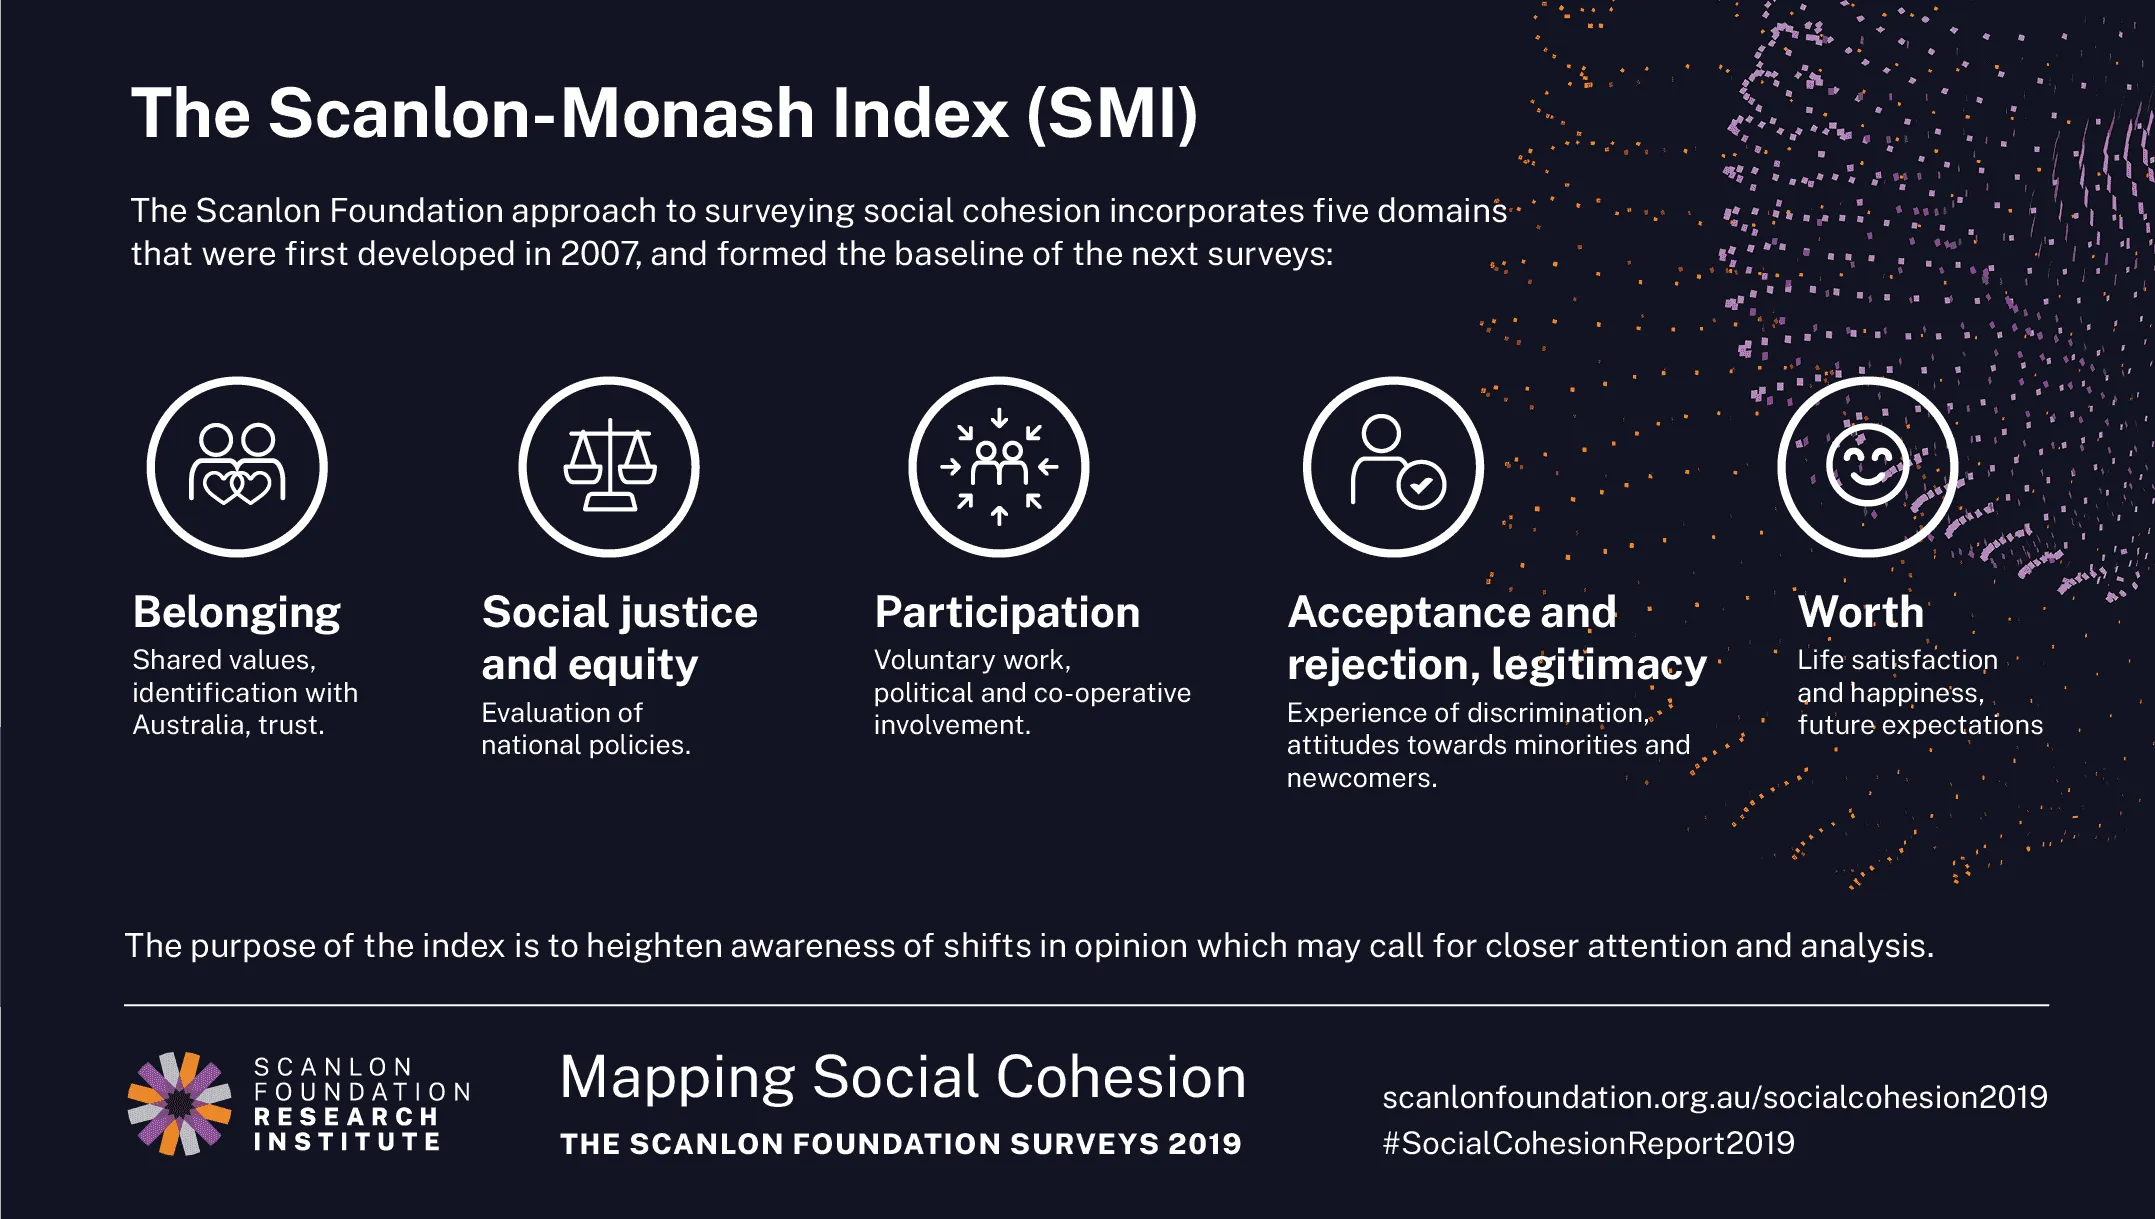
The Social Cohesion Index (SMI)
Every year, the Scanlon Monash Index (SMI) aggregates responses to 18 survey questions, which measure attitudes within the five domains conceptualising social cohesion: belonging, worth, social justice, political participation, and acceptance/rejection.
In 2019 the SMI is at 89.6, almost identical with 2018 (89.7), and close to the level of six of the last seven years, which averaged 89.2 index points.

Signs of stability
While much public discussion in 2019 has focused on problems facing the country, and potential deterioration in quality of life, the 2019 Mapping Social Cohesion survey findings find much evidence of stability (or complacency), although there has been decline in some indicators.
While Australians’ concern about climate change has seen a marked increase over the last twelve months, attitudes on immigration and democracy are largely consistent with findings from the last three years.
The Mapping Social Cohesion survey continues to provide a reference point to understand pattern and extent of change, and of the views held within the mainstream and within minorities.
They make possible the testing of claims about public opinion, and build greater understanding of social cohesion in Australia at a time of continuing population growth and international political uncertainty.