
Over the past five years, Australians have become less hopeful about their personal futures, with declining belonging, life satisfaction, and belief that hard work is rewarded. Drawing on longitudinal data from the Mapping Social Cohesion study, this Insights paper shows that pessimism is both increasing and self-reinforcing: those who expect things to worsen are more likely to remain pessimistic. Financial stress is the strongest driver of this dynamic, while discrimination compounds the effect. These findings identify groups at risk of becoming locked into negative expectations, while pointing to civic and community resources that may help Australia protect its social cohesion.
Cohesion in troubled times
We live in an increasingly divided world, with threats to peace, security, and economic progress emerging from many sources. Conflict, economic volatility, rising public debt, and the impacts of climate change are threatening human advancement.[i] Voters in Western liberal democracies are also becoming increasingly anxious about the impacts of migration, new technologies, and ageing populations.[ii] While Australia is impacted by these dynamics, the community has, for the most part, resisted a steep slide into the reactionary politics or open conflict seen in other parts of the world.[iii]
The Scanlon Index of Social Cohesion, underpinned by a nationally representative survey of Australians, recorded a score of 78 each year from 2023–25 (Figure 1). Stable aggregate cohesion, it has been argued, is ‘underpinned by strong bonds and active participation in our neighbourhoods and communities, renewed trust in government, and resilient happiness and personal wellbeing.’[iv] The stable headline score, however, reflects counteracting trends in the Index’s subdomains—notably, rising participation offsetting declines in belonging, worth, and acceptance.
Figure 1. Scanlon Index of Social Cohesion
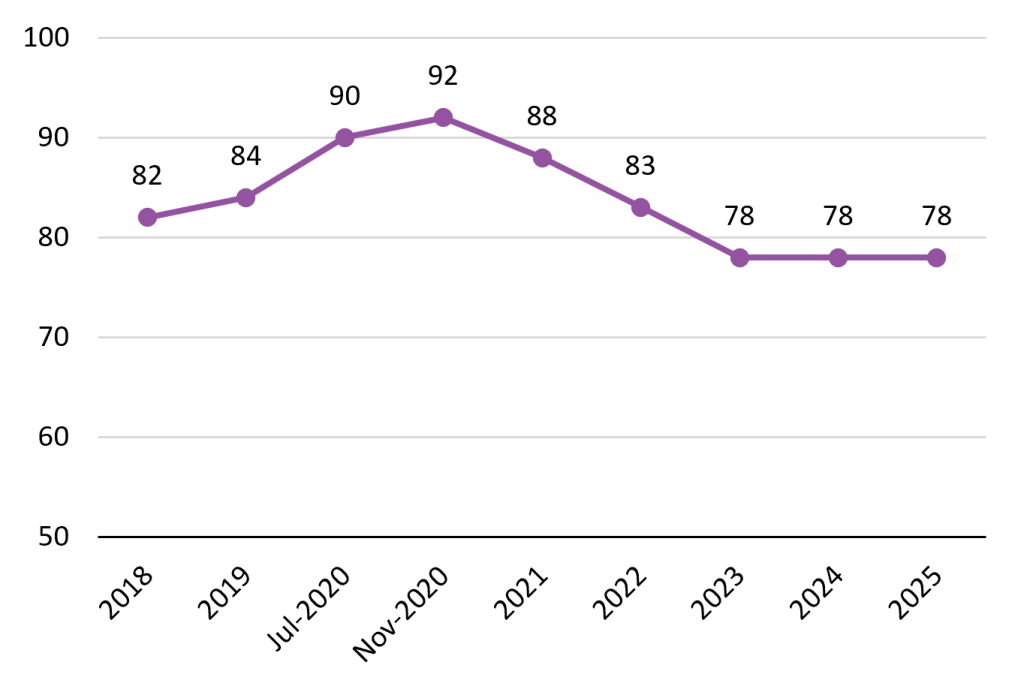
Source: O’Donnell et al. (2025), Mapping Social Cohesion.
At the same time, recent events have led to concerns that social cohesion in Australia is under threat. Domestic terrorism, violence and vandalism targeting ethnic and religious minorities, anti-migrant rallies, and attacks on police have led to widespread speculation that social cohesion may be ‘fracturing,’ ‘fraying,’ or even ‘shattering.’[v] Public protests, for instance, are now thought to be ‘more frequent, more diffuse, and more combustible at the edges’,[vi] leading to concerns that public spaces have become sites of struggle over what it means to be part of Australian society.[vii]
Contestation over Australian national identity and cohesion can also be seen in some of the data points that contribute to the Scanlon Index. Sense of belonging, for example, remains at the lowest levels recorded by the Mapping Social Cohesion surveys since 2007.[viii] The proportion of Australians who take great pride in our way of life or culture (or who agree that maintaining it is important) has also declined since the beginning of the study.[ix]
This Insights paper scrutinises the decline in key measures of social cohesion, with a focus on Australians’ level of optimism about their personal futures. Subjective optimism (or pessimism) about the future can influence social cohesion through its impact on individual health and well-being, social relationships, economic activity, and trust in public institutions.[x] Recent research has indicated that Australians are increasingly pessimistic about the future.[xi] The present analysis aims to answer the broad questions: have we become a ‘glass half full’ or ‘glass half empty’ society? For whom is optimism or pessimism more pronounced? And what are the implications for social cohesion?
‘Red flags’ for national cohesion and optimism
Figure 2 below demonstrates that Australians have exhibited a deterioration across key social indicators measured by the Mapping Social Cohesion study from 2021–25:
- Sense of belonging: the proportion of participants reporting a high sense of belonging in Australia decreased by 11 percentage points
- Fairness: agreement with the statement ‘Australia is a land of economic opportunity where hard work brings a better life’ decreased by 13 percentage points
- Life satisfaction: the proportion of individuals indicating that they felt ‘satisfied’ or ‘very satisfied’ declined by 11 percentage points
- Optimism about Australia’s future: the level of optimism about Australia’s future decreased by 12 percentage points overall (with a slight rebound in 2025)
- Personal life expectations: participants’ belief that their lives would improve over the next 3–4 years decreased by 13 percentage points
Figure 2. Social cohesion: select outcomes, 2021–25
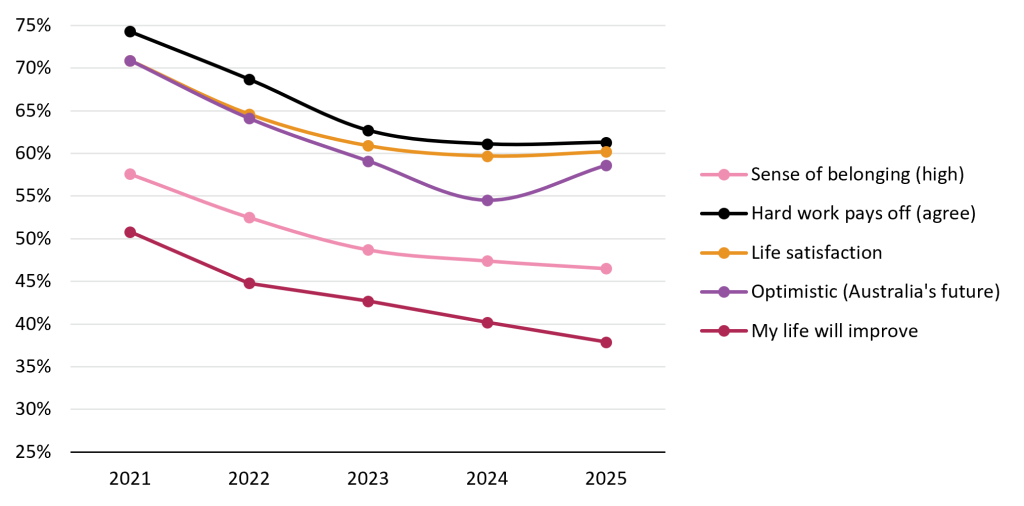
Note: Weighted proportions.
These trajectories indicate a continuing decline in some of the core elements of social cohesion. Explanations offered in scholarly literature have ranged from marginalisation of some ethnic communities to increasing financial pressure and deepening structural inequalities, affecting young people in particular.[xii] One scholar has described these trends as an ‘apparent unravelling of Australia’s social fabric,’ due to a ‘sudden lack of confidence in intergenerational progress.’[xiii] This partially accords with the 2025 Mapping Social Cohesion report, which notes, for instance, that young adults, migrants, and those who are struggling financially had the weakest levels of belonging.[xiv]
A shared sense of fate and the belief in collective future security are critical barometers of social cohesion,[xv] and here too, Australians appear to be becoming more pessimistic. Long considered an Australian cultural trait—perhaps shaped by the trope of ‘the lucky country’ of abundant natural resources, and wherein most citizens have shared a high standard of living[xvi]—recent studies have suggested that Australian optimism is actually lower than in many peer nations.[xvii],[xviii]
While many interdependent factors shape pessimism, research suggests that financial insecurity and negative ‘shocks’ can have substantial effects.[xix] The fact that only 38% of a representative sample of Australians in 2025 thought that their lives would improve in the near future may reflect the shared experiences of a ‘cost of living crisis.’[xx] The Mapping Social Cohesion data shows that the proportion of respondents experiencing financial difficulty (struggling, poor, or ‘just getting along’) grew from 31% in 2021 to 40% in 2025, which has been linked to increasing emotional distress.[xxi] The general decline in optimism about life in Australia has been confirmed by other recent Australian surveys, where such views have been associated with uncertainty about the economy and the belief that government policy responses are unlikely to have a positive effect.[xxii]
Glass half-empty or glass half-full?
Rising pessimism is thought to be a risk for social cohesion, as it affects individuals’ decision-making and how they engage with others. For instance, pessimism can compromise social relationships, reduce participation in democratic processes, and curtail volunteerism.[xxiii] Societal pessimism has been theorised as damaging to institutional trust, leading to an increase in social discord and ‘protest participation.’[xxiv]
Aggregate national statistics cannot tell us who is becoming more pessimistic over time, or why. For instance, did people who thought their lives would soon improve in 2021 still feel this way in 2025? What might explain any changes? To answer these questions, longitudinal analysis is required. The primary outcome of interest examined here is personal life outlook—respondents’ expectation of how their life in Australia will be in three to four years’ time. Responses were measured on a five-point scale: much worse, a little worse, the same as now, a little improved, or much improved.
Changing expectations
We observed a subsample of n=2,055 individuals who completed the Mapping Social Cohesion survey and relevant items each year from 2021–25 (see Appendix 1). Among this subset of individuals, the decline in optimism is even more pronounced than for the overall panel (see Figure 3). By 2025, only 31% believed that their lives would improve in the next 3–4 years (down from 49% in 2021), while the proportion who believed their lives would be ‘much worse’ doubled between 2021–25.
Figure 3. Expectations about your life in 3–4 years (balanced panel)
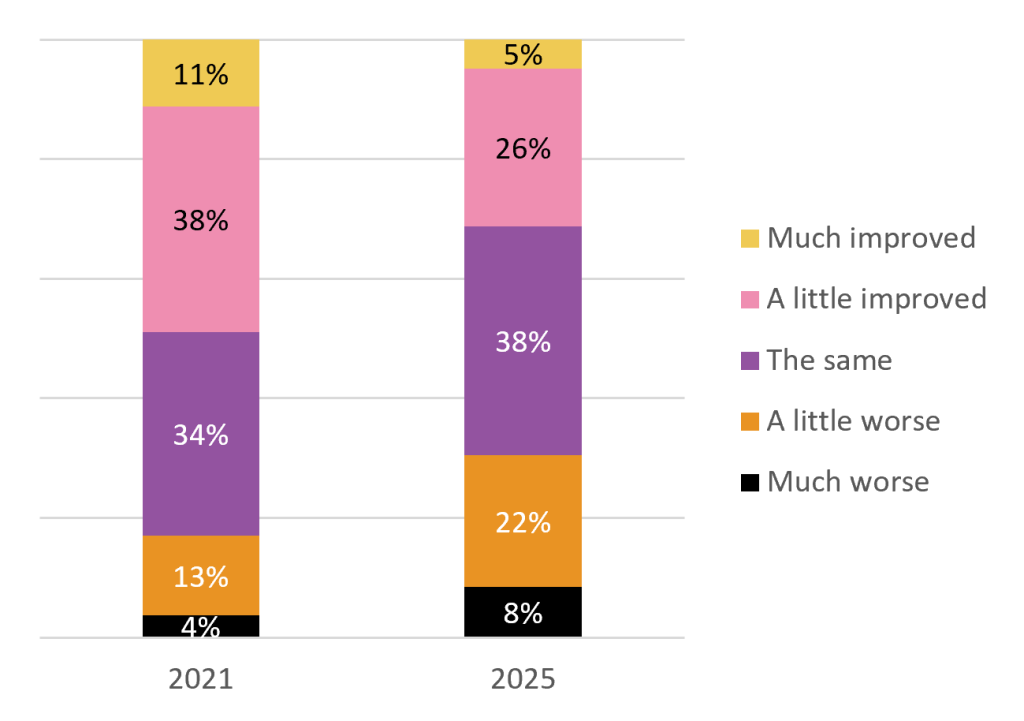
Note: Weighted proportions. n=2,050 (2021) and 2,045 (2025).
To understand whether and why people are becoming more optimistic or pessimistic about their near-term futures, the longitudinal model used here accounts for where someone stood in the previous year, as well as demographic and socioeconomic characteristics.
The model results (see Table 1 in Appendix 1) show that the most powerful predictor of people’s expectations for the future was their position in the previous year. This was especially pronounced at the negative extreme: someone who reported that their life would be ‘much worse’ the previous year was 123 times more likely to subsequently report ‘much worse’, compared to someone who had been neutral. Importantly, modest pessimism also compounded: a prior answer of ‘a little worse’ increased the likelihood of subsequently answering ‘much worse’ approximately ninefold. It was also more likely that respondents downgraded any optimistic expectations rather than improving from a pessimistic baseline.
The findings suggest that pessimism ‘sticks’; a longer duration may be required for individuals to recover from low expectations (if they do at all). The absence of significant year effects suggests that changes are better explained by prior expectations and measured financial and social circumstances than by unmeasured calendar-year shocks.
Financial stress drives pessimism
What sustains a pessimistic outlook? Financial stress was the single strongest socioeconomic predictor of negative expectations, after accounting for prior expectations (see Figure 4). Those struggling financially or in poverty were more than six times as likely to expect things to get ‘much worse’, and more than twice as likely to expect things to get ‘a little worse’, compared to those who were reasonably comfortable. Conversely, being prosperous or very comfortable was associated with a significantly lower likelihood of expecting things to get worse, and higher likelihood of expecting improvement.
Figure 4. Predicted life expectations by financial status
Discrimination amplifies a negative outlook
An experience of discrimination because of skin colour, ethnic origin, or religion increased the likelihood of expecting things to get much worse by approximately 2.6 times, and ‘a little worse’ by 30%. However, the absence of discrimination did not increase the possibility of more positive expectations.
This finding supports philosophical accounts of pessimism which posit that perceived discrimination and oppression can damage people’s ‘capacity to hope’, making it hard for them to believe in the possibility of a positive outcome, as well as undermining belief in their own agency to shape a positive future.[xxv]
Younger people, migrants, and aspirational homeowners are more optimistic
Recent Australian research has shown that young Australians (particularly those aged under 25) are more optimistic than their older counterparts.[xxvi] Analysis of longitudinal MSC data here confirms that younger age groups (under 25 and 25–44 years) were significantly more likely to expect improvement in their lives than those aged over 45. Older Australians in the model (65+, most of whom are retired) had lower expectations of improvement.
Research from the psychological sciences has suggested that optimism is highest in young adulthood, and that young people recover more quickly from stressful events than their older counterparts. Older adults may ‘preserve’ their expectations about the future, while acknowledging the probability of more negative events in their near-term future, such as decreasing health or the death of age-peers.[xxvii]
The higher relative optimism among younger people may sit uncomfortably with the earlier observation that they also share a declining sense of belonging. What may appear a counterintuitive finding, however, likely reflects two distinct psychological constructs in belonging and optimism, which can conceivably move in opposite directions.
Migrants also appear more convinced than their Australian-born counterparts that their lives will soon improve. In the model used here, people who had arrived in Australia 10+ years ago had a 30% lower risk of expecting ‘much worse’ compared to Australian-born. Recently arrived migrants (arrived less than ten years ago) were 81% less likely to expect a little worse. Speaking a language other than English at home was also associated with double the likelihood of expecting ‘much improvement’, compared to English speakers.
These effects may reflect the migrant hope of building a new life in the ‘lucky country’; previous cross-country comparisons confirm that immigrants tend to report higher optimism in settlement countries like Australia, the United Kingdom, and the United States, whereas immigrant optimism is lower in emigration contexts like Brazil, India, or Indonesia.[xxviii]
The model results also show that, relative to outright homeowners, renters are 50% more likely to report an expectation of ‘a little improved’ and nearly three times more likely to report ‘much improved’ (there is no related negative effect of renting on pessimistic outcomes). Similarly, mortgage-holders were between 39–55% more likely to be optimistic than owners. This may reflect an aspirational dynamic, whereby working towards home ownership motivates some optimism, and once achieved, no longer characterises that future outlook. However, this should be read alongside other findings: housing tenure effects do not override the strong negative effect of financial hardship.
How likely is a change in expectations for different groups?
The results discussed above demonstrate that attitudinal change is likely to vary for specific groups in the sample—primarily based on age, financial circumstances, being born overseas, or having experienced discrimination. To demonstrate how multiple factors can compound to make some people more optimistic/pessimistic than others, four distinct respondent profiles are considered:
- Profile 1: Women aged 45–64, born in Australia, university-educated, no dependent children, employed, financially comfortable, mortgage-holders, with no experience of discrimination
- Profile 2: Men under 25, born in Australia, post-school education, with dependent children, employed, financially struggling or poor, renting, with no experience of discrimination
- Profile 3: Women aged 25–44, recent migrants from non- English-speaking backgrounds, high school education, dependent children, not in the labour force (home duties), financially ‘just getting along’, renting, experience of discrimination
- Profile 4: Men aged over 65, born overseas (arrived 10+ years ago), speak English at home, high school education, no dependent children, retired, financially prosperous, own home outright in a regional area, no experience of discrimination
The probabilities of transitioning from one expectation state to another in any given year of the survey are visualised in Figure 5 below and as percentages in Tables 2-5 (Appendix 1).
Figure 5. Life expectation transitions by demographic profile
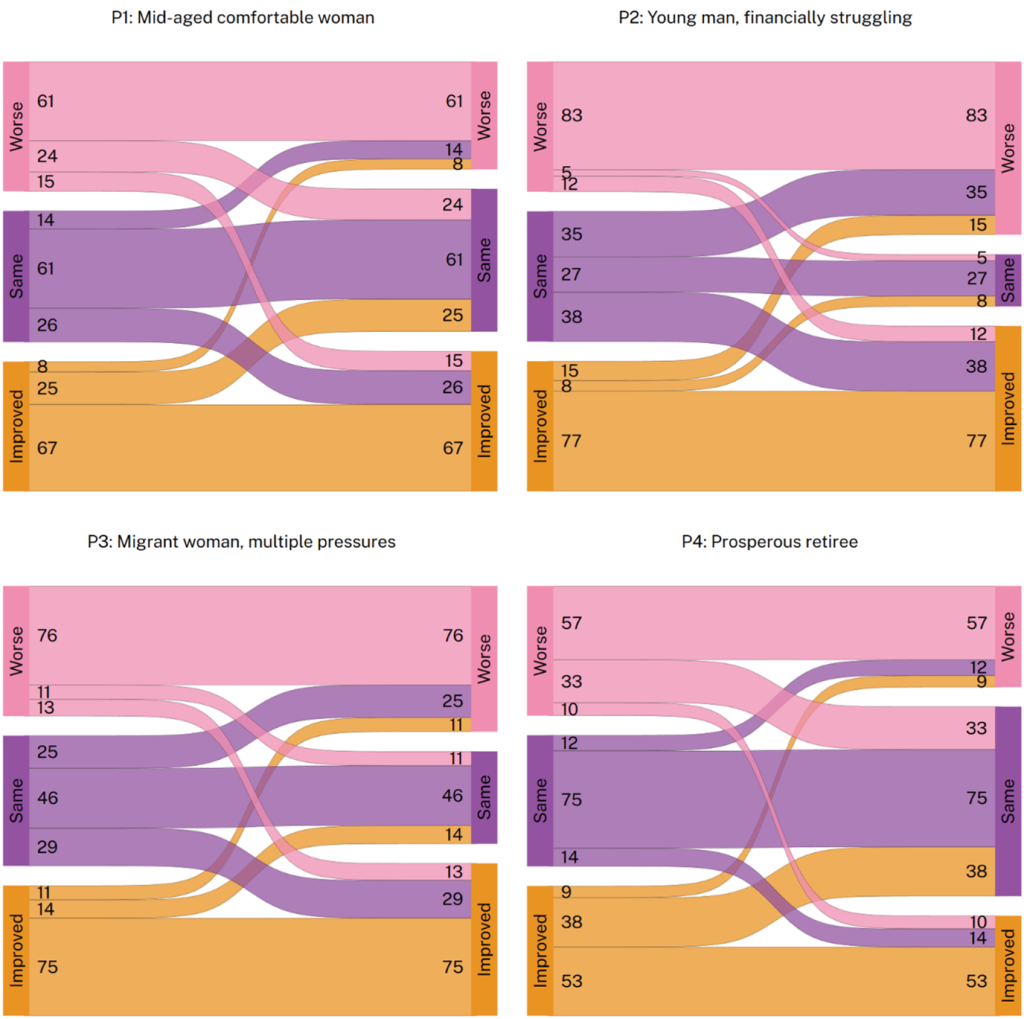
Notes: Flow widths proportional to transition probabilities (%). Left nodes = prior-year outlook; right nodes = subsequent year.
Profile 1: Middle-aged professional woman (reasonably comfortable, mortgagee, employed)
The first profile is the most stable and settled, reflected in the strong ‘neutral’ state persistence rather than decline from one year to the next. If this respondent currently expects things to be ‘the same,’ there is a 61% chance she will again expect the same next year. Even from a pessimistic state, the combination of secure finances, housing tenure (and perhaps the anchor of mid-life stability) produces meaningful recovery: pessimists in this group had a 24% probability of moving to neutral and a 15% probability of becoming subsequently optimistic.
Profile 2: Young man (struggling financially, renting, employed)
The second profile illustrates how financial hardship overshadows the optimism that might otherwise be expected of a young, employed person. The 83% persistence in pessimistic states is the highest of any profile. Being employed or an aspirational renter also does not appear to neutralise the pessimism associated with insufficient income. The neutral (‘same’) state in this profile is not stable, with only a 27% probability of remaining neutral; over one-third (35%) were subsequently likely to become pessimistic. Even those who were initially optimistic had a 15% probability of later downgrading their expectations.
Profile 3: Recently arrived woman (LOTE, discrimination, renting, not employed)
The third profile also experiences financial insecurity, compounded by experiences of discrimination (as well as being out of the labour force and with dependent children). Over three-quarters (76%) of this group were likely to remain pessimistic, with a low ‘recovery’ rate from pessimism. In addition, those who were neutral had a 25% probability of downgrading their expectations. Much of the optimism associated with home ownership aspiration or being a recent migrant is muted by financial hardship and discrimination. However, if this respondent is already optimistic, the persistence of optimism is high: once in the ‘improved’ state, there is a 75% chance of remaining there. The high persistence at both extremes suggests a polarised outlook among respondents with this profile.
Profile 4: Older retired man (prosperous, owns outright, overseas-born)
This older, secure group of Australians anticipate less dramatic change in their personal lives. The fourth profile has a much stronger ‘neutral stickiness’ than the other three, with financial security and outright home ownership creating low downward risk. Of those who believed things would stay the same in one year, there was a low 12% probability of moving to a pessimistic view in the subsequent year. A stronger positive direction is also evident among those who initially start off as pessimistic. Men in this profile who initially expect things will get worse have a 43% chance of subsequently upgrading their expectations—better than all other profiles.
Overall, the differences between the four profiles highlight that the personal outlook of Australians is strongly shaped by economic security and migration experience, in the context of different stages of the life course. Confirming the overall findings of this section, though, it is the groups experiencing the most acute financial stress and/or discrimination who appear to be falling into ‘pessimism traps’.[xxix]
Discussion
Why, in the ‘lucky country’—with relative economic and physical security and generally high standards of living—are Australians increasingly seeing their own proverbial glasses as being ‘half empty’? And what might this mean for social cohesion?
The last five years of data from the Mapping Social Cohesion study shows that our attitudes toward Australia and our futures in it have undergone a decline. The share of people with a strong sense of belonging has fallen; belief that hard work is rewarded has dropped sharply; and life satisfaction has decreased. Australians are increasingly likely to expect that their personal circumstances will worsen. These trends represent broad, population-level deterioration in social and economic confidence.
A negative outlook is shaped by financial stress and negative social experiences. But pessimism is not shared equally across the population. A financially comfortable, middle-aged professional woman has a relatively stable, broadly optimistic outlook, with the chance of more positive reassessment. A financially struggling young man, in contrast, has an 83% chance of remaining trapped in pessimistic expectations, with low likelihood of transitioning to a more neutral outlook. A recently arrived migrant woman from a non-English-speaking background, experiencing financial hardship and discrimination is almost equally likely to be pessimistic; though, if she is already optimistic will remain there, possibly reflecting the high ambitions many migrants bring to Australia. By contrast, a retired, financially secure older man exhibits the most neutral transition probabilities.
For some, pessimism can ‘stick’, in that people who have low expectations about their near-term futures are subsequently more likely to remain in this negative state rather than move in a more positive direction. Described in the literature as a ‘pessimism trap,’ these negative beliefs about one’s likelihood of success can cause people to pursue ‘less risky, modest ends, instead of ambitious ones.’[xxx]
Conclusion
In an address to the National Press Club prior to the 2025 Federal Election, Prime Minister Anthony Albanese contrasted his optimistic vision for Australia with the Opposition’s ‘fear and negativity,’ reassuring voters that his party had an economic plan for stability ‘in the face of global uncertainty.’[xxxi] This optimistic message was likely delivered in recognition of broader attitudinal trends moving in the opposite direction.
Our analysis demonstrates that people who are struggling financially (a growing proportion of Australians) will be more likely to have low expectations about their near-term futures; and crucially, this effect operates independently of their employment or housing status. Discrimination also amplifies pessimism, and its absence has no compensating positive effect. Overall, people who expect their lives to worsen are strongly likely to remain in that state.
This suggests that policies and reforms targeting employment or housing supply alone are unlikely to sufficiently counter ‘fear and negativity.’ More direct interventions may be needed, such as cost-of-living relief targeted at those who are ‘just getting along’ as well as those in outright poverty. In addition, the findings challenge anti-discrimination efforts: removing a source of harm is not the same as restoring a ‘capacity for hope.’
When people experience financial stress or discrimination and come to expect little improvement, it is feared that pessimism may become not only a private outlook, but a constraint on trust, reciprocity, and collective confidence. In response, the philosopher Mara van der Lugt makes a case for ‘hopeful pessimism’, challenging us to rethink how individuals and institutions might act in response to living in troubled times. She argues that pessimism is,
“simply the assumption of a dark view of the present as well as the future… [it] does not imply the loss of courage or insistence to strive for better: on the contrary, often these are the very gifts that pessimism can bestow.”[xxxii]
This framing combines an acknowledgement of real structural problems with a commitment to act, rather than to counsel or comfort with ‘crude optimism.’ The Mapping Social Cohesion data does point to protective factors that provide a foundation: sustained civic participation, neighbourhood cohesion, and community connection remain relatively robust, even as belonging, personal expectations or overall outlooks have declined. In other words, if the glass is half empty, there is still something left in the glass—and we have the resources to fill it back up.
[i] William R. White, “The Case for Pessimism,” The International Economy (Washington, United States) 37, no. 2 (2023): 40-41,57-58, https://www.proquest.com/docview/2857455430/citation/74E7072D0454D67PQ/1.
[ii] Eduardo Bericat, Towards the Future of Europe: Social Factors Shaping Optimism and Pessimism among Citizens (Eurofound, 2021), https://doi.org/10.2806/458259.
[iii] Nicholas Biddle, Erosion of Hope: Social and Financial Wellbeing and the Relationship with Political Attitudes (ANU School of Political and International Relations, 2025).
[iv] James O’Donnell et al., Mapping Social Cohesion 2025 (Scanlon Foundation Research Institute, 2025), 3, https://scanloninstitute.org.au/mapping-social-cohesion-2025.
[v] Peter Hartcher, “Australia’s Cohesion Is Fraying. If We’re Not Careful, It May Shatter,” Federal, The Age, September 5, 2025; SMH, “Ley Believes Australia’s Social Cohesion Is ‘Fraying,’” The Sydney Morning Herald, January 5, 2026.
[vi] John Coyne and Justin Bassi, Social Insecurity: Cohesion, Outrage Economics and National Resilience in Australia, Report (The Australian Strategic Policy Institute (ASPI), 2026), https://www.aspi.org.au/report/social-insecurity-cohesion-outrage-economics-and-national-resilience-in-australia/.
[vii] Pearl Subban, “What Anti-Immigration Marches Teach Us about Belonging in Australia,” Monash Lens, February 10, 2026, https://lens.monash.edu/what-anti-immigration-marches-teach-us-about-belonging-in-australia/.
[viii] O’Donnell et al., Mapping Social Cohesion 2025.
[ix] O’Donnell et al., Mapping Social Cohesion 2025.
[x] Jesse Renaud et al., “The Developmental Origins and Future Implications of Dispositional Optimism in the Transition to Adulthood,” International Journal of Behavioral Development 43, no. 3 (2019): 221–30, https://doi.org/10.1177/0165025418820629; PennState, “Fear and Societal Pessimism,” Applied Social Psychology (ASP), December 10, 2024, https://sites.psu.edu/aspsy/2024/12/10/fear-and-societal-pessimism/; Bericat, Towards the Future of Europe.
[xi] Biddle, Erosion of Hope: Social and Financial Wellbeing and the Relationship with Political Attitudes.
[xii] Alanna Kamp, “Mapping Social Cohesion in Australia: A Decade of Research on National Attitudes and Values,” Cosmopolitan Civil Societies: An Interdisciplinary Journal 16, no. 3 (2024): 27–48, https://doi.org/10.3316/informit.T2025010600015290899884966; Rachel Sharples and Val Colic-Peisker, “Social Cohesion Revisited: Policy and Practice in Migrant Concentration Areas of Sydney and Melbourne,” Australian Journal of Social Issues 57, no. 1 (2022): 215–32, https://doi.org/10.1002/ajs4.136; James O’Donnell, “Social Cohesion, Diversity and Inequalities in Australian Communities,” Journal and Proceedings of the Royal Society of New South Wales 156, nos. 489–490 (2023): 61–69, https://doi.org/10.3316/informit.201970054685071.
[xiii] Deborah Cobb-Clark, Inequality, Intergenerational Fairness, and the Social Contract, Working Paper no. 01, Working Paper Series (Institute for Social Science Research, The University of Queensland, 2025), https://lifecoursecentre.org.au/working-papers/inequality-intergenerational-fairness-and-the-social-contract/.
[xiv] O’Donnell et al., Mapping Social Cohesion 2025, 7.
[xv] Karen N. Breidahl et al., “Do Shared Values Promote Social Cohesion? If so, Which? Evidence from Denmark,” European Political Science Review 10, no. 1 (2018): 97–118, https://doi.org/10.1017/S1755773916000266; Thomas Szanto, “Feeling Belonging and Feeling Solidarity: Two Forms of Social Cohesion?,” in The Phenomenology of Belonging, ed. L. Dolezal and D. Petherbridge (SUNY Press, Forthcoming).
[xvi] Nina Evason, “Core Concepts,” Cultural Atlas: Australian Culture, 2016, https://culturalatlas.sbs.com.au/australian-culture/australian-culture-core-concepts.
[xvii] Ying Chen et al., “The Distribution of Optimism across Sociodemographic Groups in 22 Countries,” Scientific Reports 15, no. 1 (2025): 14553, https://doi.org/10.1038/s41598-024-77257-1.
[xviii] For example, while over half (59%) of Australians in the 2025 Mapping Social Cohesion study said they were optimistic about the country’s future, a similar question asked in 2025 Eurobarometer surveys showed an average of 57% across 27 European countries—and most of the EU27 nations had greater than 59% total optimism. European Parliament, EP Autum 2025 Survey: Results Annex, EB 104.2 (European Parliament, 2025), https://europa.eu/eurobarometer/surveys/detail/3632 Table QA9.2.
[xix] Alan Piper, “Optimism, Pessimism and Life Satisfaction: An Empirical Investigation,” International Review of Economics 69, no. 2 (2022): 177–208, https://doi.org/10.1007/s12232-022-00390-8; Ronald Fischer and Anna Chalmers, “Is Optimism Universal? A Meta-Analytical Investigation of Optimism Levels across 22 Nations,” Personality and Individual Differences 45, no. 5 (2008): 378–82, https://doi.org/10.1016/j.paid.2008.05.008.
[xx] Lucas Walsh, “Youth Barometer: Australia’s Young People Are Losing Faith in the Future,” Monash Lens, November 13, 2025, https://lens.monash.edu/housing-insecure-work-and-mental-health-australias-young-people-are-losing-faith-in-the-future/.
[xxi] Phoebe Johnston, Stretched Thin: The Emotional Toll of Financial Stress, no. 9, Social Cohesion Insights, no. 4 (Scanlon Foundation Research Institute, 2025), https://scanloninstitute.org.au/publications/insights/social-cohesion-insights-09-stretched-thin-the-emotional-toll-of-financial-stress/.
[xxii] Biddle, Erosion of Hope: Social and Financial Wellbeing and the Relationship with Political Attitudes; Sarah Cameron et al., The 2025 Australian Federal Election: Results from the Australian Election Study (The Australian National University and Griffith University, 2025).
[xxiii] Eric M. Uslaner, “Volunteering and Social Capital: How Trust and Religion Shape Civic Participation in the United States,” in Social Capital and Participation in Everyday Life (Routledge, 2001).
[xxiv] Eefje H. Steenvoorden, “Societal Pessimism: A Study of Its Conceptualization, Causes, Correlates and Consequences” (Universiteit van Amsterdam, 2016).
[xxv] Katie Stockdale, “Social and Political Dimensions of Hope,” Journal of Social Philosophy 50, no. 1 (2019): 28–44, https://doi.org/10.1111/josp.12270; Jennifer M. Morton, “Resisting Pessimism Traps: The Limits of Believing in Oneself,” Philosophy and Phenomenological Research 104, no. 3 (2022): 728–46, https://doi.org/10.1111/phpr.12809.
[xxvi] Biddle, Erosion of Hope: Social and Financial Wellbeing and the Relationship with Political Attitudes.
[xxvii] Julia Tetzner et al., “Stability and Change of Optimism and Pessimism in Late–Midlife and Old Age across Three Independent Studies,” Psychology and Aging 39, no. 1 (2024): 14–30, https://doi.org/10.1037/pag0000789.
[xxviii] Chen et al., “The Distribution of Optimism across Sociodemographic Groups in 22 Countries.”
[xxix] Morton, “Resisting Pessimism Traps.”
[xxx] Morton, “Resisting Pessimism Traps.”
[xxxi] The Hon Anthony Albanese MP, “Address to the National Press Club,” Speech, National Press Club, Canberra, January 24, 2025, https://www.pm.gov.au/media/2025-01-24-address-national-press-club.
[xxxii] Mara van der Lugt, “Look on the Dark Side,” Aeon, April 26, 2022, https://aeon.co/essays/in-these-dark-times-the-virtue-we-need-is-hopeful-pessimism.
Social Cohesion Insights #10, May 2026
Appendix 1
Data and methods
The analysis in this paper draws on the Mapping Social Cohesion longitudinal dataset, comprising five annual survey waves collected between 2021 and 2025. Chi-squared tests (design-adjusted for survey weights) were used to assess whether overall distributions changed significantly over time.
To examine how people’s personal life expectations evolve from one year to the next, a multinomial logistic regression model was estimated using the full five-year panel (restricted to n= 2,055 five-wave completers, yielding 7,494 person-year observations after accounting for the one-year lag). This represented approximately 16% of all survey respondents from 2021–25.
The dependent variable examined here is respondents’ expectation of how their life in Australia will be in three to four years’ time, measured on a five-point scale: much worse, a little worse, the same as now (the reference outcome), a little improved, and much improved.
The model includes the prior year’s response as a predictor, capturing state dependence, or where people’s current views are shaped by where they stood the previous year. The lagged variable increases confidence that attitudinal change is not attributable to compositional differences of the panel. Several sociodemographic independent variables were also included. Standard errors were clustered at the individual level to account for the repeated-measures structure of the data.
Model coefficients are presented below in Table 1 as Relative Risk Ratios (RRRs)—values greater than 1 indicate an increased likelihood of that outcome relative to ‘same as now’; values below 1 indicate a reduced likelihood. The model had a pseudo-R2 value of ~0.21, indicating that the included variables explain roughly one-fifth of the variation in life outlook responses.
Variance inflation factors (mean VIF = 4.19) confirmed no meaningful multicollinearity among most predictors.[1] The VIFs for age group and labour force status categories were high and elevated the overall mean, but this is attributable to a structural overlap between the 65+ age and retirement categories, and to a lesser extent the prime working age (25–64) and employment categories. The collinearity between these variables means that the age coefficients need to be interpreted as net of labour force status, as they are not cleanly separated in the data.[2]
Multinomial logit coefficients were then used to compute predicted transition probabilities for four specific respondent profiles. Each profile fixes all covariates at values representing a specific type of person, and produces, for each possible prior-year outlook, the full probability distribution over next-year outcomes. These probabilities indicate which groups are more likely to transition to more positive/negative states.
Table 1. Multinomial logistic regression model: Life expectation transitions
| Much worse RRR [95% CI] | A little worse RRR [95% CI] | A little improved RRR [95% CI] | Much improved RRR [95% CI] | |
| Prior-year expectation (ref: The same) | ||||
| Much worse | 122.79*** [70.74, 213.13] | 10.86*** [7.10, 16.60] | 1.30 [0.69, 2.45] | 6.96*** [2.94, 16.46] |
| A little worse | 8.96*** [6.34, 12.66] | 5.77*** [4.78, 6.97] | 1.40** [1.13, 1.73] | 1.79* [1.04, 3.06] |
| A little improved | 0.97 [0.59, 1.58] | 1.33** [1.10, 1.60] | 4.02*** [3.41, 4.73] | 5.48*** [3.81, 7.89] |
| Much improved | 2.30 [0.96, 5.48] | 1.76* [1.14, 2.72] | 7.40*** [5.40, 10.16] | 65.53*** [40.07, 107.16] |
| Survey year (ref: 2022) | ||||
| 2023 | 1.08 [0.74, 1.59] | 1.09 [0.89, 1.32] | 1.02 [0.85, 1.22] | 1.07 [0.76, 1.49] |
| 2024 | 0.89 [0.64, 1.24] | 1.13 [0.95, 1.35] | 0.95 [0.80, 1.12] | 0.97 [0.72, 1.31] |
| 2025 | 1.09 [0.79, 1.51] | 0.91 [0.76, 1.08] | 0.86 [0.73, 1.02] | 0.87 [0.64, 1.19] |
| Gender (ref: Female) | ||||
| Male | 1.28* [1.00, 1.64] | 1.34*** [1.16, 1.55] | 1.19** [1.04, 1.36] | 1.46** [1.14, 1.86] |
| Age group (ref: 45–64 yrs) | ||||
| Under 25 yrs | 1.30 [0.26, 6.44] | 1.75 [0.73, 4.19] | 3.23*** [1.77, 5.88] | 3.01* [1.28, 7.07] |
| 25–44 yrs | 0.73 [0.51, 1.04] | 0.79* [0.64, 0.98] | 1.45*** [1.22, 1.73] | 1.28 [0.97, 1.70] |
| 65+ yrs | 0.85 [0.56, 1.28] | 0.87 [0.70, 1.08] | 0.77* [0.62, 0.95] | 0.97 [0.61, 1.54] |
| Country of birth (ref: Born in Australia) | ||||
| Overseas-born ≥10 years | 0.70* [0.49, 1.00] | 0.79* [0.65, 0.96] | 0.90 [0.76, 1.07] | 1.02 [0.72, 1.45] |
| Overseas-born <10 years | 0.30 [0.03, 3.08] | 0.19** [0.06, 0.59] | 0.65 [0.34, 1.27] | 1.46 [0.64, 3.31] |
| Speaks LOTE at home (ref: No) | ||||
| Yes | 1.11 [0.56, 2.23] | 1.03 [0.67, 1.57] | 1.19 [0.81, 1.76] | 2.00* [1.12, 3.57] |
| Overseas-born × LOTE interaction | ||||
| Overseas-born ≥10 years × Yes | 0.85 [0.34, 2.12] | 0.92 [0.54, 1.55] | 0.76 [0.48, 1.22] | 0.75 [0.36, 1.57] |
| Overseas-born <10 years × Yes | 3.88 [0.28, 53.47] | 5.61* [1.37, 23.00] | 1.84 [0.75, 4.48] | 1.26 [0.41, 3.91] |
| Children in household (ref: No) | ||||
| Yes | 0.96 [0.73, 1.27] | 1.06 [0.90, 1.25] | 1.06 [0.91, 1.23] | 1.17 [0.89, 1.54] |
| Experienced discrimination (ref: No) | ||||
| Yes | 2.57*** [1.83, 3.61] | 1.27* [1.02, 1.59] | 0.96 [0.77, 1.20] | 0.93 [0.67, 1.28] |
| Education (ref: Year 12 or below) | ||||
| Diploma/Certificate | 1.03 [0.73, 1.45] | 0.91 [0.75, 1.11] | 0.97 [0.79, 1.18] | 0.62* [0.41, 0.93] |
| Bachelor’s | 1.12 [0.77, 1.65] | 0.97 [0.78, 1.22] | 1.04 [0.84, 1.29] | 0.84 [0.57, 1.23] |
| Postgraduate | 0.98 [0.66, 1.45] | 1.09 [0.88, 1.34] | 1.11 [0.91, 1.36] | 1.07 [0.73, 1.56] |
| Labour force status (ref: Other/’home duties’) | ||||
| Student | 0.24* [0.07, 0.84] | 0.89 [0.40, 1.99] | 1.76 [0.88, 3.50] | 1.51 [0.58, 3.96] |
| Retired | 0.75 [0.45, 1.24] | 1.13 [0.79, 1.61] | 1.08 [0.74, 1.56] | 0.41** [0.21, 0.79] |
| Unemployed | 1.63 [0.84, 3.14] | 1.30 [0.77, 2.21] | 1.85* [1.09, 3.13] | 1.18 [0.52, 2.68] |
| Employed | 1.21 [0.81, 1.83] | 1.14 [0.83, 1.57] | 1.50* [1.09, 2.07] | 0.80 [0.49, 1.32] |
| Financial status (ref: Reasonably comfortable) | ||||
| Struggling/poor | 6.08*** [4.10, 9.01] | 2.12*** [1.61, 2.80] | 0.79 [0.57, 1.08] | 1.05 [0.66, 1.66] |
| Just getting along | 2.43*** [1.78, 3.33] | 1.61*** [1.35, 1.91] | 0.87 [0.74, 1.03] | 0.64* [0.45, 0.91] |
| Prosperous/very comfortable | 0.94 [0.59, 1.51] | 0.60*** [0.49, 0.75] | 1.07 [0.90, 1.27] | 1.91*** [1.45, 2.53] |
| Home ownership (ref: Own outright) | ||||
| Other | 1.58 [0.94, 2.63] | 0.83 [0.57, 1.20] | 1.19 [0.84, 1.68] | 1.18 [0.62, 2.27] |
| Renting | 0.88 [0.60, 1.30] | 0.95 [0.75, 1.21] | 1.50*** [1.21, 1.87] | 2.65*** [1.71, 4.10] |
| Mortgage | 0.69* [0.48, 0.98] | 0.92 [0.75, 1.11] | 1.39*** [1.16, 1.67] | 1.55* [1.05, 2.28] |
| Region (ref: Capital city) | ||||
| Regional | 1.02 [0.79, 1.32] | 1.17* [1.01, 1.37] | 0.91 [0.79, 1.05] | 0.95 [0.72, 1.26] |
Note: RRR=Relative risk ratio. N = 7,494. Multinomial logistic regression; “The same as now” is the base outcome. Standard errors clustered by respondent (n = 1,965 clusters). RRR = relative risk ratio. *** p<0.001, ** p<0.01, * p<0.05. Model fit: Wald χ²(128) = 2756.52, p<0.001; pseudo R² = 0.21.
Table 2. Life expectation transition probabilities (%), P1: Middle-aged professional woman (reasonably comfortable, mortgagee, employed)
| Subsequent year | |||
| Prior year | Worse | Same | Improved |
| Worse | 61.1 | 24.0 | 14.9 |
| Same | 13.7 | 60.6 | 25.7 |
| Improved | 8.3 | 25.1 | 66.5 |
Table 3. Life expectation transition probabilities (%), P2: Young man (struggling financially, renting, employed)
| Subsequent year | |||
| Prior year | Worse | Same | Improved |
| Worse | 83.0 | 5.3 | 11.6 |
| Same | 35.0 | 26.6 | 38.3 |
| Improved | 14.9 | 8.0 | 77.1 |
Table 4. Life expectation transition probabilities (%), P3: Recently arrived woman (LOTE, discrimination, renting, not employed)
| Subsequent year | |||
| Prior year | Worse | Same | Improved |
| Worse | 76.4 | 11.1 | 12.5 |
| Same | 24.9 | 45.8 | 29.3 |
| Improved | 10.5 | 14.1 | 75.4 |
Table 5. Life expectation transition probabilities (%), P4: Older retired man (prosperous, owns outright, overseas-born)
| Subsequent year | |||
| Prior year | Worse | Same | Improved |
| Worse | 57.4 | 32.9 | 9.7 |
| Same | 12.0 | 74.5 | 13.5 |
| Improved | 9.0 | 38.1 | 53.0 |
Notes: Predicted one-year transition probabilities. Rows sum to 100% with rounding. Highlighted cells indicate state-persistence rates.
Endnotes
[1] Robert M. O’Brien, “A Caution Regarding Rules of Thumb for Variance Inflation Factors,” Quality & Quantity 41, no. 5 (2007): 673–90, https://doi.org/10.1007/s11135-006-9018-6.
[2] Jeffrey M. Wooldridge, Introductory Econometrics: A Modern Approach, 6th ed. (Cengage Learning, 2016).
